For example, the daffodils I have planted in the garden bloomed five days later than several houses around the block - probably due to the amount of sun they receive.
I have kept a kind of nature calendar for a bunch of years. March 25 - piping plovers return to NJ (prune evergreens; turn compost; sow peas and spinach) April 26 - bluefish run usually begins. April 29 - first piping plover nests on Jersey beaches. You get the idea.
For centuries farmers, naturalists, and scientists have kept records of the patterns of plants and animals and used the information to predict the best time for planting and harvesting crops and when to start expecting problems with insect pests.
There are other "citizen scientists" out there. You can join thousands of others in gathering environmental and climate change information from across the country in a program called Project BudBurst.

It asks you to make careful observations of the phenophases in your area such as first leafing, first flower, and first fruit ripening of a diversity of trees, shrubs, flowers, and grasses. What is really important is to observe the first day of the appropriate phenophase (like the first flower).
Phenology (which I had never heard of, even though I was doing it) is the study of the timing of life cycle events like leafing, budding, and blooming in plants.
What makes it more important of late is that the timing of phenological events of many species has changed recently as a result of changing temperatures and rainfall patterns. The average global temperature increased by 0.6°C ( 1.0°F) during the 20th century. The temperature is predicted to rise with another 1.8 to 4.0°C ( 3.2 to 7.2°F) in the 21st century. That probably seems like pretty small variations, but at the global scale it can have dramatic effects on the environment.
It's the kind of data that leads most scientists to believe that this will cause the sea level to rise with 10 to 89 cm (4 to 35 inches) during this century.
Climate change has the largest effect on plants because, unlike many animals, they cannot move easily from one area to another.
The results might be that the growing season could start earlier or continue over a longer period of time. In my part of north NJ, the official last frost date is May 15, but I have been keeping track myself and a May frost has been the exception for my little microclimate in he past 20 years.
So, watching for the phases of the plant life cycle (phenophases) causes you to be very mindful of things like temperature, rainfall and day length. Monitoring changes in events such as first bud, budburst, and flowering, can help scientists detect climate change.
If you volunteer to take part in Project BudBurst, you track climate change by recording the timing of flowers and foliage. The project started as a pilot program in 2007 operated by the University Corporation for Atmospheric Research (UCAR), the Chicago Botanic Garden, and the University of Montana. They are collecting thousands of observations from students, gardeners, and others to give researchers a more detailed picture of our warming climate. It's crowdsourcing data collection.
Looking at data from 2007 and 2008 gives a baseline for the timing of key plant events. 4,861 observations were reported online in 2008 from participants in every state except Hawaii.
There's lots of information on the project site and at the links below, but here are some basics:
- Each participant in Project BudBurst selects one or more plants to observe. (The project website suggests more than 75 widely distributed trees and flowers, with information on each and you can add your own choices.)
- You start by checking your plants at least a week prior to the average date of budburst--the point when the buds have opened and leaves are visible.
- After budburst, you continue to observe the tree or flower for later events, such as seed dispersal.
- When you submit records online, you can view maps of these phenophases across the United States.
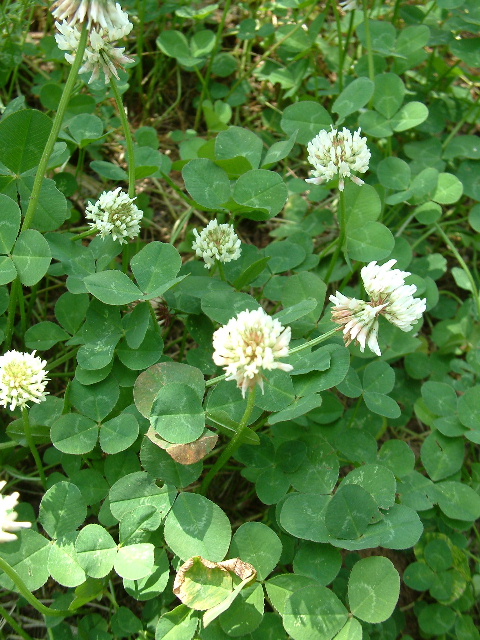 When white clover (Trifolium repens) pops up in my lawn, maybe I won't spray it, but observe it.
 Did you know that it is in the plant family of the pea or legume (Fabaceae)? White clover, like other members of the pea family, fix nitrogen. This makes clover an important agricultural and rangeland plant—by planting it with grasses it is possible to increase the grass yield. Clover leaves and flowers are also good forage for wildlife, such as moose, grizzly bear, white-tailed deer, and blue grouse. Clover is used widely by bees to produce honey.
I like both the scientific side of this - and I like being more mindful of the natural world around me.
I recommend you taking up this in your own little part of the world. You can certainly do it for yourself, but sharing the information with the Project really adds another level of awareness.
- Project Budburst
- USA National Phenology Network
- The National Center for Atmospheric Research
- UCAR Office of Programs
This post first appeared on Weekends in Paradelle
No comments:
Post a Comment